Use Firebug's console.debug Command to Analyze Javascript, DOM Objects
Occasionally when debugging my Javascript code I need to be able to analyze the properties of an unknown object; for instance, an unexpected DOM object passed to an event handler. How do you analyze the properties of an object when you don’t know what the object is? I was looking for a way to list all the properties of a generic Javascript or DOM object when I stumbled across this blog post by Andrew Peters. In it, he very clearly outlines two ways of doing this, but the one I found most useful was Firebug’s console.debug command. You’ll need to use Firefox with the Firebug extension for this, but the results are impressive.
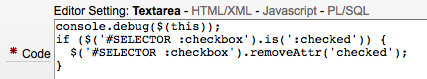
When you want to debug an object, simply pass it as a parameter to console.debug. Here is an example where I wanted to find out about the event trigger object passed to my event handler:
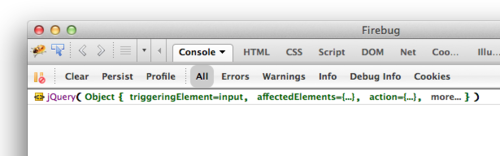
After triggering the event, I opened the Firebug window and navigated to the console. From there I could drill down on the displayed results to get information about my unknown DOM object.
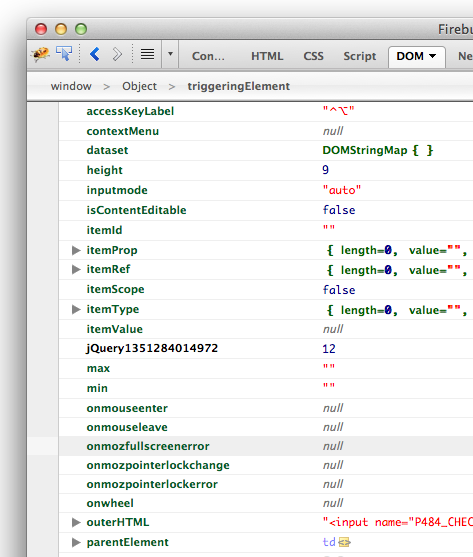
Turns out in this case that the event handler was attached to the wrong object, due to the “id” value being placed one level above in the DOM hierarchy than I was expecting. Tricky, but I was able to spot the problem immediately using this method.