Discovering Command-line Java Profiling Tools
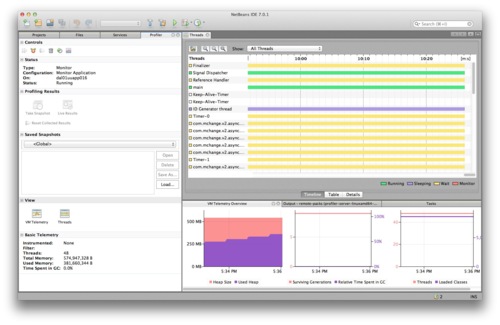
At my current client I am responsible for administering a third-party Java appplication that unfortunately generates a lot of performance complaints. It’s a multi-tiered system with the middle-tier running on Oracle Appication Server 10.1.3. I am already familiar with GUI profiling tools like jconsole and jvisualvm, both of which are included with Oracle’s JDK, and I have played around with the profiling capabilities in NetBeans. All of these profiling tools are fairly similar to one another in look and functionality.
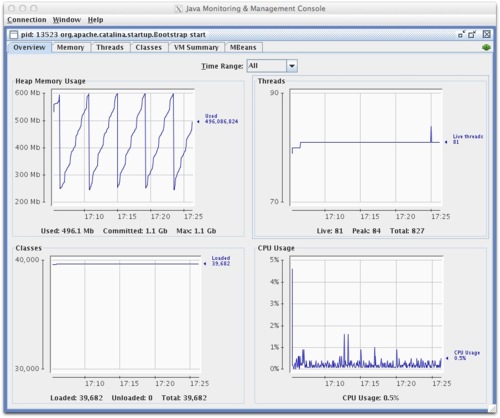
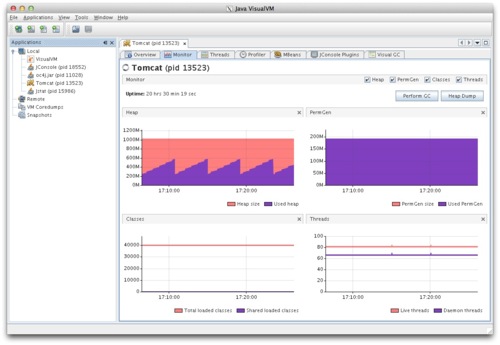
Using any one of these tools, I can view the size and utilization of the heap, see the status of running threads, monitor CPU loads, pull garbage collection statistics, and generate a memory dump. All of these are adequate for monitoring application performance in real-time, but while working with the application vendor to diagnose problems I found it necessary to be able to report on application performance over longer spans of time, say days or even weeks. We were trying to show patterns of eroding performance, or possibly spot instances of very slow memory leaks in parts of the application that got used less frequently. In any event, it required a way to monitor all of these details without having to have my eyes on the screen the whole time.
My goal was to get all that data exposed by the aforementioned GUI tools into a database that I could report off of. A little research on the internet (HT to Ted Neward) and some digging around in man pages provided the solution.
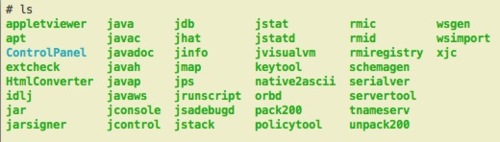
Recent versions of the JDK come packaged with some nifty command line tools to assist with profiling your Java applications. They can all be found in the /bin directory under the JDK base directory.
##jps
The jps command is a lot like the ps command in Unix/Linux, in that it lists running processes. Jps, however, will only list discoverable Java processes. If a running Java process is not included in the list returned by jps, you may still be able to profile it; it just doesn’t advertise itself as attachable.
Each Java process is identified by the “VMID” returned by jps, usually corresponding to the process ID on the host system. It is this VMID which is required as an argument to all of the other tools we will discuss, so be sure to always use jps to correctly identify your processes to the other tools.

##jstack
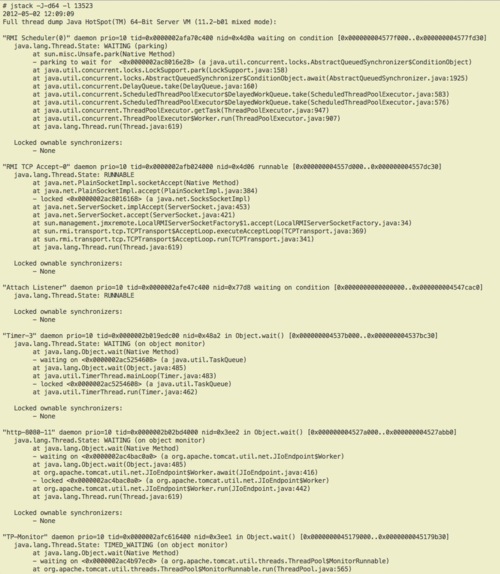
Use jstack to generate a thread dump for a running Java process. It gives you a nice snapshot of thread activity comparable to what you might get in one of the GUI tools mentioned above. You get the name of the thread, the current state, a stack trace, and with the -l option you get additional information about locking conditions. If an actual deadlock is detected you get a detailed breakdown of which threads are holding the locks! For comprehending the overall state of threads in an application it can actually prove superior to some of its GUI counterparts, as it’s faster to scan the results; i.e. no need to click from thread to thread or drill down to view the details.
Jstack can be used in conjunction with jmap and jhat to get a more comprehensive picture of application state at a critical point in time.
Note: If you have a 64-bit JDK, you’ll want to use the -J-d64 flag when running the command.
##jmap & jhat
These two tools work together to help you analyze the contents of the heap. Use jmap to generate a heap dump, and jhat to help analyze the dump file.
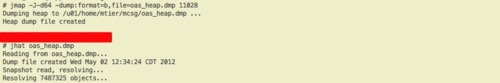
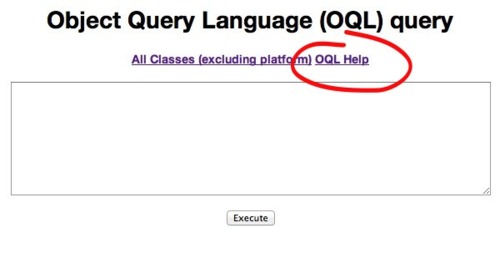
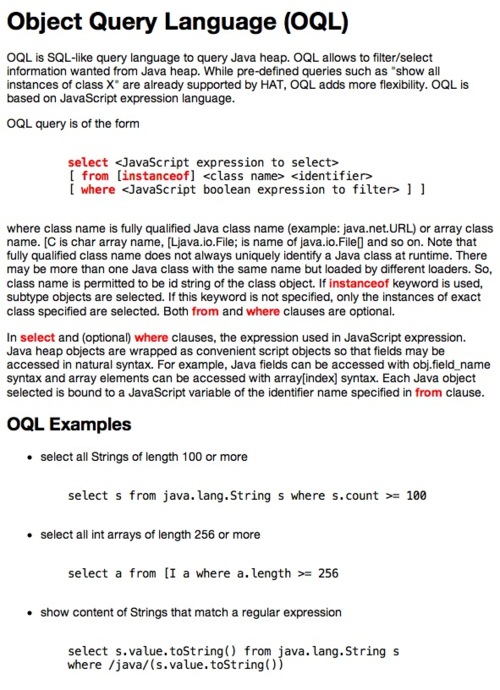
Jhat works by spawning an HTTP server that presents the contents of the heap as a web page, allowing you to drill down on a specific object to view its members and references. In order to get the most out of jhat, however, it would be worth investigating OQL, the Object Query Language, as the web page generated by jhat allows you to run OQL queries against the heap. If you know a little about your application class structure, this makes your heap analysis far more efficient. Thankfully, the jhat web page provides you with a short primer.
Jmap is good for more than just generating heap dumps, however. When used with the -heap option it gives you a nicely formatted heap usage summary.
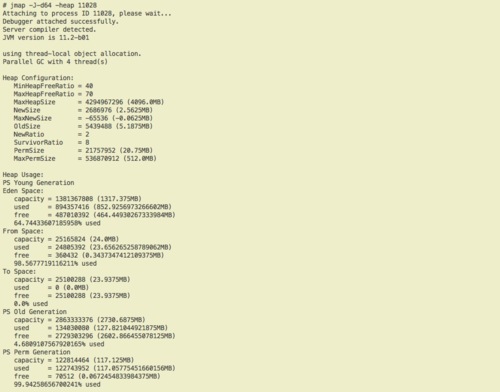
Now I was getting closer to my goal. In fact, this was originally the output I parsed during my first attempt at statistics gathering. Unfortunately, what I found while running on an RHEL 4.7 box with JDK 1.6.0_30 was that jmap would from time to time inexplicably refuse to attach to my Java process, leaving gaping holes in my report. I noticed similar complaints online, so I figured there may be problems with it.
# jmap -J-d64 -heap 11028
Attaching to process ID 11028, please wait...
Error attaching to process: sun.jvm.hotspot.debugger.DebuggerException: Can't attach to the process
Note: Once again, be sure to use the -J-d64 flag with jmap if you’re running a 64-bit JVM.
##jstat
Jstat was what saved the day for me. Jstat displays detailed heap usage, class loader, and garbage collection statistics for the JVM; basically everything I wanted to report on. Jstat has numerous options that allow you to focus in on usage statistics for different parts of the JVM.
- -class
Statistics on the behavior of the class loader. - -compiler
Statistics of the behavior of the HotSpot Just-in-Time compiler. - -gc
Statistics of the behavior of the garbage collected heap. - -gccapacity
Statistics of the capacities of the generations and their corresponding spaces. - -gccause
Summary of garbage collection statistics (same as -gcutil), with the cause of the last and current (if applicable) garbage collection events. - -gcnew
Statistics of the behavior of the new generation. - -gcnewcapacity
Statistics of the sizes of the new generations and its corresponding spaces. - -gcold
Statistics of the behavior of the old and permanent generations. - -gcoldcapacity Statistics of the sizes of the old generation.
- -gcpermcapacity Statistics of the sizes of the permanent generation.
- -gcutil Summary of garbage collection statistics.
- -printcompilation
HotSpot compilation method statistics.
Like the heap profiling features of the GUI tools mentioned earlier, the results of jstat can be used to check for memory leaks or to better tune your JVM startup parameters. Like the vmstat command, jstat can be set to repeat at a specified interval, for an infinite or specific number of iterations. Since jstat has so many options and output formats, I will examine it in more detail in a later blog post when I discuss how I used it to populate my application instrumentation table.
One thing that should be noted is that all of these tools are documented as being “unsupported” and experimental. Oracle make no guarantees that they will be included in future versions of the JDK or that their output or arguments will not change. Still, though, they’ve been around for a while and since they’re there, why not make use of them? Just don’t build any critical production processes off of them if you want total flexibility in taking future JDK upgrades.
In my next post I’ll examine how I used these tools to automate the process of instrumenting my third-party Java app. I’ll also provide you with a script I wrote that formats the output of jstat to look something like the -heap option of jmap, providing an equivalent, but more reliable, solution.